1) Run tophat in iPlant {Gill Expression Zhang et al. v9_90}
--
converting oyster CDS gff to gtf for tophat?
Started adding GTF file that has CDS and mRNA data - looks for splice junctions.
Results
------
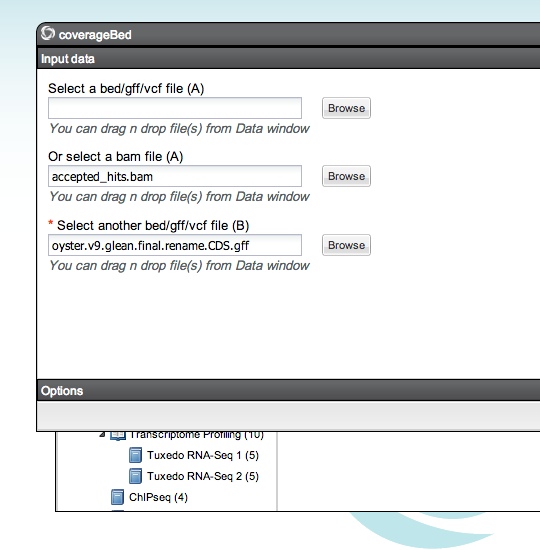
2) Get coverage on CDS
-split
http://eagle.fish.washington.edu/cnidarian/TJGR_Gil_Exp_TH_coverage_CDS.txt
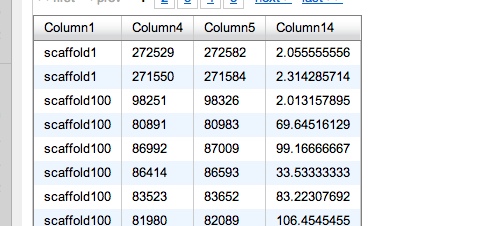
Default Output:
After each entry in B, reports:
1) The number of features in A that overlapped the B interval.
2) The number of bases in B that had non-zero coverage.
3) The length of the entry in B.
4) The fraction of bases in B that had non-zero coverage.
cleaned up in excel
column on end - num A overlap / length of B
http://eagle.fish.washington.edu/cnidarian/TJGR_Gil_Exp_TH_coverage_CDS.txt
SELECT Column1,Column4,Column5,Column14 FROM [sr320@washington.edu].[table_TJGR_Gil_Exp_TH_coverage_CDS.csv]
Where Column14 > 2
Now using Galaxy to filter "high expression"
Using last column(column14) - 0.7 is about 22% CDS with highest expression
format: gff, database: oyster_v9_90
Filtering with c14>=0.7, kept 22.65% of 196691 valid lines (196691 total lines).
Back in SQL
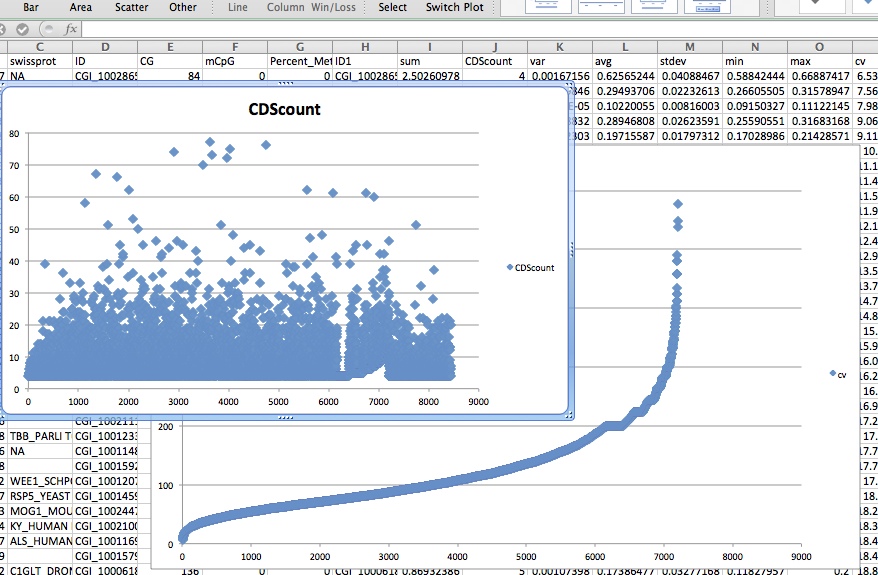
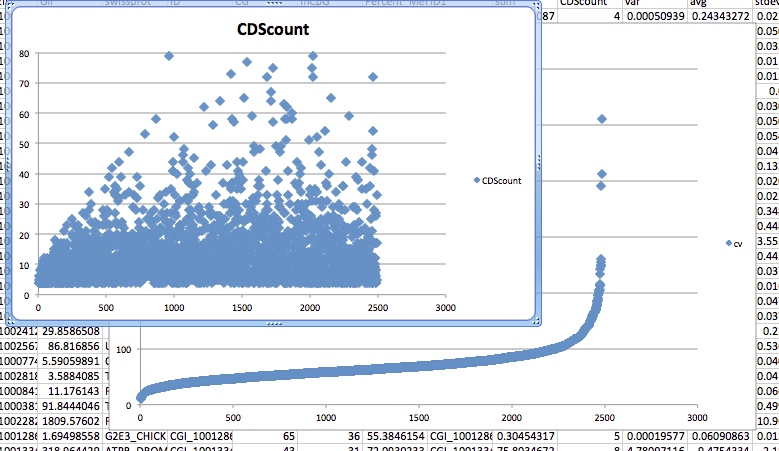
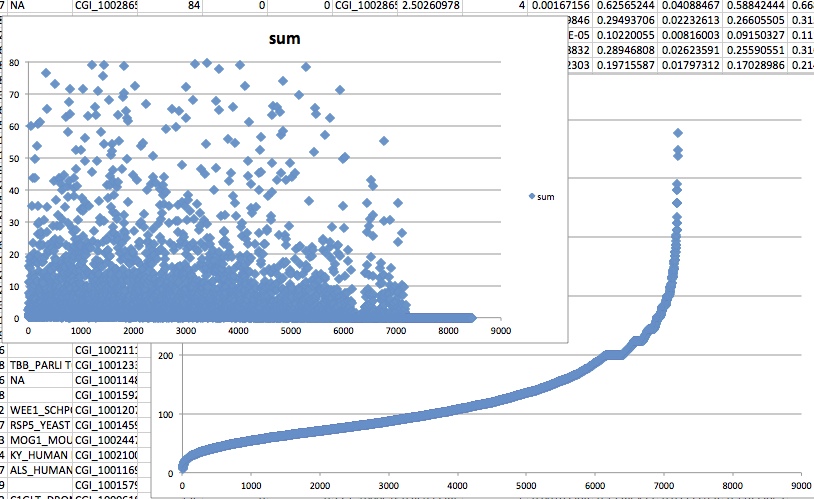
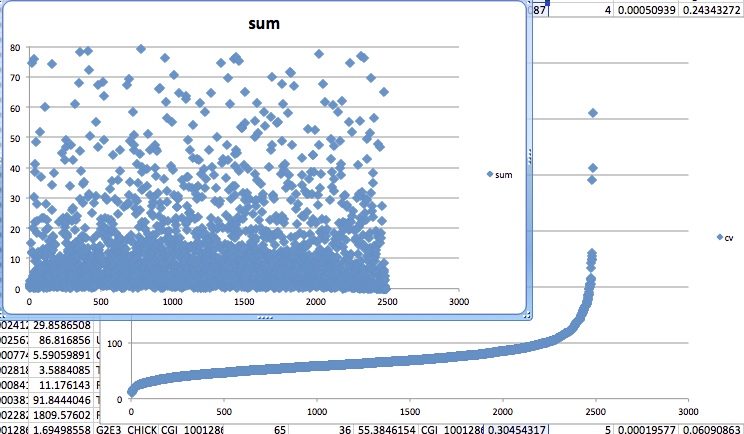
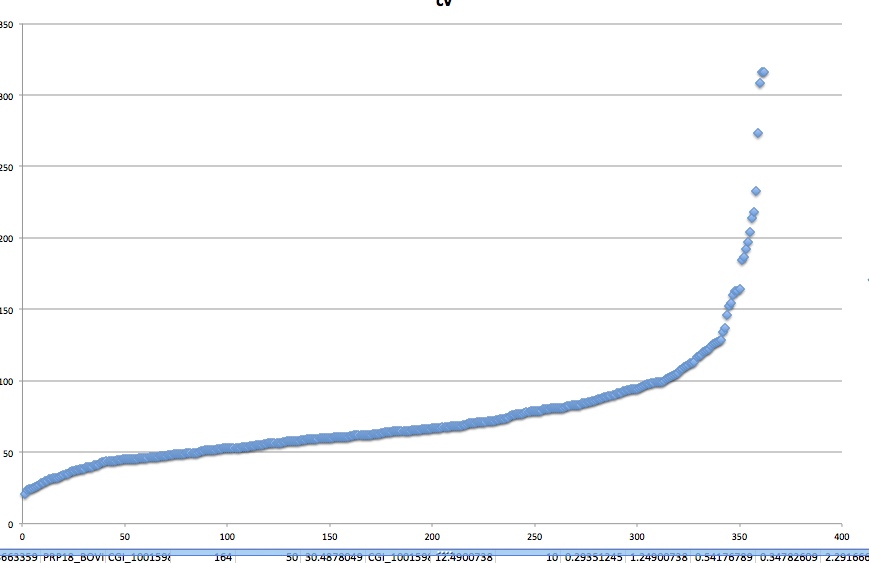
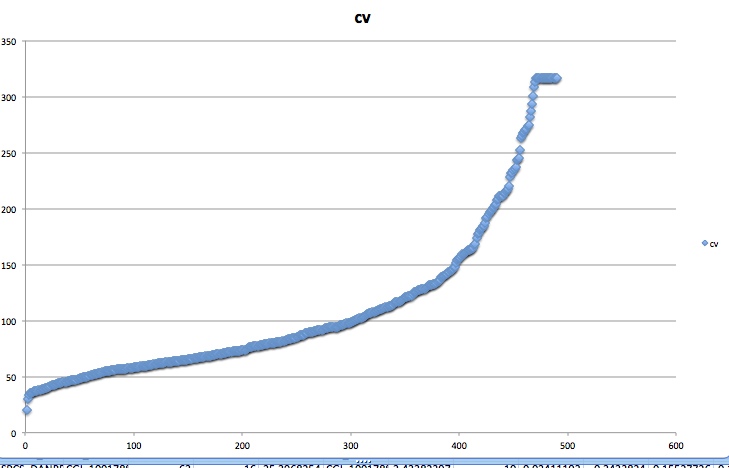
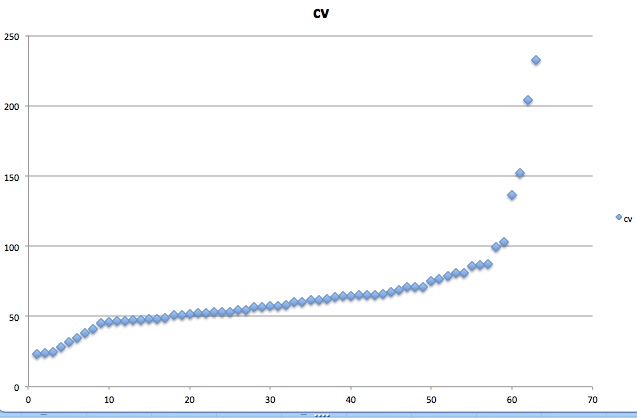
SELECT Column9, sum(Column14),count(Column14),(stdev(column14)/avg(Column14)),var(column14),avg(Column14),stdev(column14),min(column14),max(Column14) FROM [sr320@washington.edu].[table_TJGR_Gil_Exp_TH_coverage_CDS.csv]
Group by Column9
SELECT * FROM [sr320@washington.edu].[Gil_Exp_coverage_CDS_SummaryStats]
Where Column4 ]]
]]>
0
avg Expression > 0
NOW have Gill Expression coverage on CDS with Stats; including CV
http://eagle.fish.washington.edu/cnidarian/TJGR_Gil_cov_CDS_stats_cv.txt
Once have mCpG data for gill MBD library, will see if there is a relationship
./intersectBed -c -a /Users/sr320/Desktop/oyster.v9.glean.final.rename.mRNA.gff -b /Users/sr320/Desktop/TJGR_GillMBD_mCpG_10xcov.bed > /Users/sr320/Desktop/TJGR_mRNA_intersect_gillMBDmCpG
SELECT Column9, sum(Column10) FROM [sr320@washington.edu].[table_TJGR_CDS_intersect_gillMBDmCpG]
Group by Column9
Join mCpG data will all CG - mRNA
http://eagle.fish.washington.edu/cnidarian/TJGR_Gill_percentMeth_gene.txt
JOINING
[sr320@washington.edu].[TJGR_Gill_meth_CDSexpression_gene]
--
SELECT GENEID,Gil,swissprot
FROM [sr320@washington.edu].[table_Table S14.csv]
Join with Gill Expression
SELECT * FROM [sr320@washington.edu].[Gill_Done]
CDS count = 10
Select * From [sr320@washington.edu].[Gill_Done_2]
Where Percent_Meth ]]
]]>
20
and CG ]]
]]>
10
and CDScount = 10
Select * From [sr320@washington.edu].[Gill_Done_2]
Where Percent_Meth < 40
and CG ]]
]]>
10
and CDScount = 10
Select * From [sr320@washington.edu].[Gill_Done_2]
Where Percent_Meth ]]
]]>
60
and CG ]]
]]>
10
and CDScount = 10
---
DH BB3 Expression
---
3) Get extraCDS windows in mRNA (maybe flank)
3b) Get coverage on extraCDS windows
----
Join in SQLshare and select datasets with similar overall expression, x # exons,
stats to try to identify alternative splicing…
--
What about relationship with SNPs
#get that.